
20 Social Media Holidays to Celebrate This May
By Yasmin PierreApr 10
Unlock the secrets to staying ahead in the ever-evolving world of social media marketing.
Published March 1st 2022
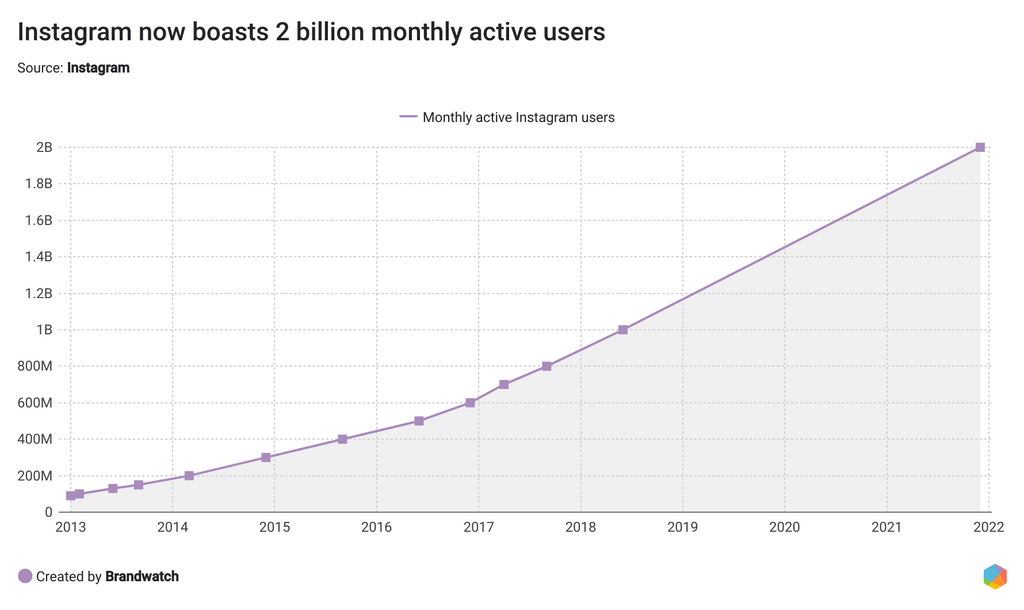
If you’re a social media pro, we don’t need to tell you how massive Instagram is. IG officially has over 1 billion monthly active users, and over 400 million people now use Instagram Stories every day.
Users aren’t the only ones who love Instagram though—marketers and brands have found their place on it too. It’s visually appealing, extremely popular, and offers a super friendly ecosystem for businesses.
After all, 80% of Instagram users follow at least one branded account, and 60% say they use the platform to discover new products. Advertisers have clearly noticed this, as they’re set to spend over 10 billion dollars on Instagram ads in 2019.
In many industries, Instagram is crucial not only for social media marketing, but for building online communities and engaging with customers on a daily basis. Everyone who works with social media needs to be looking at Instagram strategically as one of the top channels out there.
But how do you know if you’re doing Instagram right? How do you know if your social media strategy is working or if you’re meeting your quarterly goals?
That’s what Instagram analytics are for.
To go straight to our top five countdown of the most important Instagram metrics to track, just click the links below:
Instagram analytics are how you understand the performance of your posts and your account overall.
Whereas Instagram metrics are individual stats, Instagram analytics help you interpret those stats and see patterns in them. For example, follower count (how many followers you have) is a metric, while follower growth rate (how fast your follower count is growing over time) is an analytic.
Looking at your Instagram analytics is one of the best ways to identify failures and successes on your account. By reviewing them carefully, you can get useful feedback to help you improve your social media strategy.
There are two main ways you can access analytics about your account: through Instagram’s native tool called Instagram Insights or through a third party Instagram analytics tool like Brandwatch.
Instagram Insights is a great way to see basic analytics about your account, your posts, and your followers. It shows you a variety of different data, from how many users visited your profile in the last week to when your followers are typically online.
It’s only available to business profiles or accounts that receive a lot of engagement, but the good news is it’s really easy to create a business profile on Instagram.
The main downside of this native analytics tool is how limited the date ranges are. For most metrics, you can only see how your performance during the current week has changed compared to last week. That’s probably the number one reason to switch to an Instagram analytics app or platform—but we’ll get to the pros and cons at the end of the article.
First, here’s how to see Instagram Insights on your business profile.
If you already have a business profile set up, accessing your account Insights is pretty simple. Note that Insights are currently not available for desktop users—to see them, you’ll need to have the Instagram app installed on a smartphone or other mobile device.
Once you’ve opened the app, just follow these steps:
There are three main sections on Instagram Insights: Accounts reached, Accounts engaged, or Total followers.
Accounts reached shows you the number of accounts that have seen your content, along with some demographic information on them. The main metrics are:
Accounts engaged shows you the number of accounts that have engaged with your content, the types of engagements, along with some demographic information on your engagers. The main metrics are:
Total followers shows you the number of followers you have, along with some demographic information on them. The main metrics are:
That’s a lot of analytics. You should have no shortage of data and trends to pore over to perfect your Instagram strategy. Now the problem is deciding which metrics you should be focusing on.
To improve your posts, your profile, and your overall strategy, you need to use what you’ve learned from your Instagram analytics to see what’s working for you and what isn’t.
When there’s so much data available, though, where do you even begin?
As any seasoned social media marketer will tell you, the metrics you should be following depend on what you want to achieve through your Instagram presence.
If you work in ecommerce and want to use Instagram to make sales, website clicks and conversions matter more than, say, video views. Meanwhile, a social media manager at a university looking to foster community at their school should probably be looking more closely at the engagement rate on their posts.
All Instagram metrics are not created equal, however. Some offer a great deal of insight into what your best content is while others don’t say much at all. These are the top five metrics we recommend tracking on Instagram to learn what’s working for you and improve your social media strategy.
Your follower count on Instagram may be a simple metric, but it’s also a very important one. The number of followers you have affects the overall performance of your Instagram account in a variety of ways.
Think about it. Do you want to increase the reach of your posts? The more followers you have, the more you’ll reach. Want to get more engagement or more website clicks? The more people following you, the more engagement and clicks you’ll get.
More specifically, follower growth rate is a great way to measure the health of your Instagram account. You should be tracking not only how many followers you’ve gained over the past weeks, months, and years, but also how fast your follower base is growing.
Follower growth rate vs. follower count
It’s more important to understand analytics about your rate of follower growth over time than to just see how many followers you have at the moment. For example, if your follower count increased 1% in January, 2% in February, and 8% in March, you can see that your account may be approaching viral growth and that you’re clearly doing something right.
On the other hand, if your follower growth rate was 8% in January, 2% in February, and 1% in March, you should note that your account is expanding more slowly—possibly because of changes you’ve made to your content or your Instagram strategy.
If your growth rate is negative, that means you’re actively losing followers. That should warn you that something is seriously wrong.
Unfortunately, follower growth isn’t included in Instagram Insights. Insights does show how many followers you’ve gained or lost compared to the previous week, but it doesn’t have analytics on follower growth over time.
To get around this, you have two options: manually record your follower count each day/week/month in a spreadsheet and calculate the percent change yourself, or use an Instagram analytics tool that will record and analyze your followers over time for you.
While it’s super helpful to know how fast you’re gaining followers, you also need to understand who your followers are.
Whether you want to improve engagement with your posts, drive web traffic or make sales, knowing your audience is crucial to a successful Instagram strategy. A thorough understanding of your audience demographics will allow you to hone your content and make sure your followers resemble your target persona.
For instance, if you’re the social media manager for an American sneaker store that wants to appeal to Millennial customers but you have an Instagram audience of the opposite,, that should tip you off that a few changes are in order.
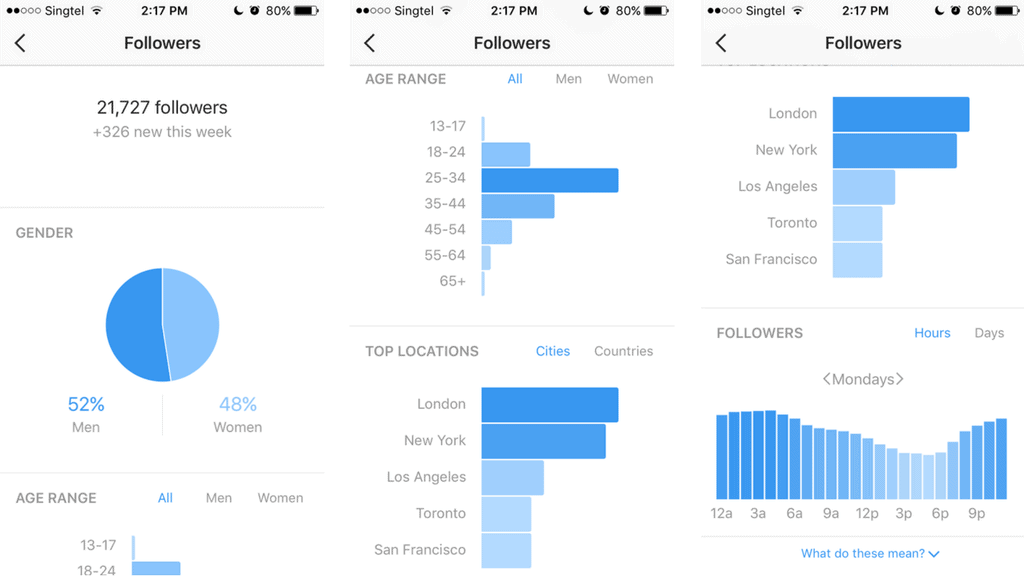
Instagram Insights offers some pretty good analytics about audience composition. You can see the gender and age makeup of your followers, as well as your top five cities and countries in terms of follower count.
Many analytics tools go a bit more in depth, offering data on more than five locations or showing exactly how many followers you have in each country for example.
How to get value from your audience demographics
To make the most of your insights from audience demographics, construct an ideal target persona for your Instagram account. Who do you want to appeal to the most? How old are they? Where do they live? What language do they speak?
Once you’ve got this target persona figured out, use it as a benchmark to check your audience demographics and see how closely your actual followers resemble your ideal follower.
If there’s a major difference, you should reconsider your content strategy. How can you change the style and tone of the images, videos, and copy you’re posting to make it more appealing to the people you actually want to reach?
Alternatively, if your brand has a widespread appeal across demographics and you don’t have a specific target persona in mind, Instagram audience analytics are still useful. By seeing who’s in your fan base and where they’re located, you can better tailor your content to appeal to the people that follow you and match their interests.
Instagram website clicks are exactly what they sound like: a metric for how many people clicked from your Instagram profile to your website or landing page.
This metric is crucial for some Instagram accounts and relatively unimportant for others. If your main priority on Instagram is to drive traffic, conversions, or sales, you need to be looking at analytics on website clicks.
On the other hand, if you’re on Instagram mostly to build a community and raise brand awareness, you don’t need to monitor Instagram web traffic as carefully.
For most accounts, we’d argue that Instagram generally works better as a branding and community channel than as a sales or traffic channel. However, Instagram’s increasing popularity and broadening ecommerce options like shoppable posts mean the network shouldn’t be ignored as a way to boost your traffic or conversions.
If you’re getting a lot of website clicks, it probably means you have a lot of visitors to your profile and a compelling CTA in your Instagram bio (as we recommend in our best practices for creating a professional IG bio).
If you’re not getting clicks, you should change up the CTA and link in your bio regularly. You can also direct people to your chosen URL by hyping up the page it links to in your post copy or latest Story, then saying ‘Link in bio’ at the end.
Tracking web traffic from Instagram
Instagram Insights offers basic data on how many people have clicked the link in your bio over the past week in the Activity Section under Interactions. While this is a good start, you can get much more detailed information by using a web analytics tool like Google Analytics or Facebook Pixel.
To see how much traffic is arriving on your website from Instagram (along with a ton of other data), we recommend adding a UTM code to the link in your bio, shortening it with a URL shortened, then looking at Google Analytics data on that URL. If you’re more interested in analyzing conversions from your ads, you may want to set up conversion tracking with Facebook Pixel.
While reach isn’t the main key performance indicator (KPI) for most social media managers, it’s very helpful for measuring how much brand awareness and buzz you’re generating with your content.
So what is reach on Instagram? Essentially, it’s a metric that tells you how many people have seen your posts. Each account that views your photo, video, or Story counts as one account reached.
But what’s the difference between reach and impressions on Instagram?
Whereas impressions are counted every time your content is seen, reach is only counted once per unique user. We always recommend looking at reach instead of impressions, as impressions are more of a vanity metric.
You’ll always have more impressions than reach, but impressions don’t tell you much. If someone scrolls past your photo eight times without really looking at it, that counts as eight impressions.
Do those impressions help you or your brand more than if that person scrolled past the photo once or twice? Probably not. If what you actually want to know is how many people have seen your content, reach is a more accurate measurement.
Instagram Insights shows you how many accounts you’ve reached in the last week in the Activity tab, including how many people were reached each day. You can also see the reach of your individual posts and Stories in the Content tab for a variety of different time frames by adjusting your filters:
Why reach matters
Reach is useful as a metric because it tells you which of your posts are showing up in the most people’s feeds. A lot of factors affect reach on Instagram, like how many people engaged with your post after seeing it, how long they spent looking at it, or what time of day you published it. Because of that, reach can tell you in broad strokes how popular, well-timed, and engaging your posts are.
If your posts are reaching a high percentage of your followers, that’s probably a sign that people are spending a lot of time looking at them and engaging with them. Or it means your posting schedule is working. Or maybe both—checking your engagement rate will help you figure this out.
If you notice your average post reach is getting lower, take note of when you’re publishing content versus when your followers are online. Also, check if your engagement numbers are decreasing. And that brings us to our next top metric.
Engagement is king on Instagram. It’s a great network for connecting with fans and customers, starting conversations, and building communities. In fact, Instagram has the highest average engagement rate for brands of all major social networks.
For any social media managers or digital marketers looking to measure the success of their content on Instagram, engagement is the best place to start.
Why? For starters, the Instagram algorithm rewards posts that get good engagement. Which posts come first in users’ feeds depends a lot on how much engagement those posts have and how fast people engaged with them after they were initially posted.
This makes sense intuitively. Instagram wants to provide a positive user experience, so they give priority to posts that people find the most engaging.
But what is engagement on Instagram exactly? Engagement is the total number of likes, comments, and saves on your post. You can see the total engagement on all your posts by adjusting your filters within the Content tab of Instagram Insights:
Engagement vs. engagement rate on Instagram
What about your engagement rate? Engagement rate is a better metric than just engagement for determining how interesting your posts actually are. It tells you what percentage of people that saw your post engaged with it.
If one post has really high reach and another has really low reach but they get the same amount of total engagement, you can see that the post with low reach was more compelling by looking at engagement rate rather than engagement.
While engagement rate isn’t shown in your Instagram Insights, you can easily calculate it yourself. Simply divide the total number of engagements with your post by the total reach of your post, then multiply the result by 100 to get a percentage.
Say your latest pic gets 100 engagements and 1000 reach. (100/1000) x 100% = 10% engagement rate. Easy enough, right?
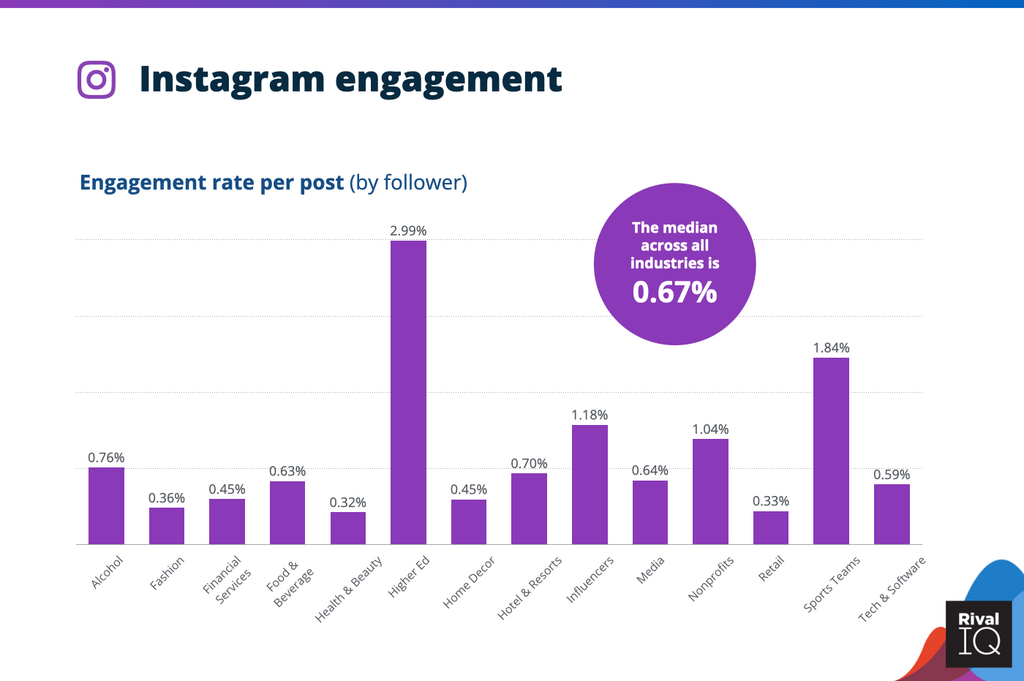
What’s a good engagement rate to shoot for as a brand on Instagram? According to this 2022 benchmark by Rival IQ (pictured at the top of this section), anything over 1.75% is above average after the recent algorithm changes. If you’re struggling to hit that level, try these powerful tips to improve your Instagram engagement.
Now that we’ve gone through the top five metrics you should be tracking on Instagram, you may be wondering if Instagram Insights alone can provide you with the analytics you need.
That depends on how deep you want to dive into the data and on what resources are available to you. Of course, there are pros and cons to looking at your Instagram analytics natively versus through a third party tool. Let’s compare:
Pros of native Instagram Insights:
Cons of native Instagram Insights:
Pros of Instagram analytics tools:
Cons of Instagram analytics tools:
Offering up analysis and data on everything from the events of the day to the latest consumer trends. Subscribe to keep your finger on the world’s pulse.
Leverage the industry-leading, all-in-one social media management solution.
Existing customer?Log in to access your existing Falcon products and data via the login menu on the top right of the page.New customer?You'll find the former Falcon products under 'Social Media Management' if you go to 'Our Suite' in the navigation.
Brandwatch acquired Paladin in March 2022. It's now called Influence, which is part of Brandwatch's Social Media Management solution.Want to access your Paladin account?Use the login menu at the top right corner.